CRO
Does seeing the model sell the suit?
Model photos on suiting category pages lifted revenue per visitor by 50%.
Overview The short version
Wax London showed hanger shots as the first image on suiting category pages. Most fashion sites do the same. We thought suits were different. Fit, shoulder line, and how the cloth hangs are hard to judge from a flat photo. Seeing the jacket on a person might help.
So we ran an A/B test on six suiting collections. Convert called it Model vs Product Image on suiting category pages. Variation 1 turned on Wax London’s Model view toggle. The first tile image became a model shot. Copy, layout, and everything else stayed the same. One change: the photo.
The test ran for 29 days, from 17 April to 15 May 2026. 14,115 people saw it, split 50/50. Then we stopped it in Convert.
Hypothesis Why we ran this test
We wanted a straight answer. On suiting pages, does a model photo as the first image beat a product-only photo?
If we show a model wearing the suit as the first image, more people will look and buy, because they can see the fit and how it looks on a body.
A t-shirt is easy to guess. A suit is not. You cannot tell from a hanger how a jacket sits on the shoulders, or how the trousers break at the ankle. A model photo answers that in a second.
Pages in this test:
- waxlondon.com/collections/suits
- waxlondon.com/collections/blazers
- waxlondon.com/collections/tailored-trousers
- waxlondon.com/collections/linen-suits
- waxlondon.com/collections/single-breasted-suits
- waxlondon.com/collections/double-breasted-suits
Test setup What we changed
Two versions. Same six pages. Traffic split evenly. Convert sent all visitors into the test. The only change was the first image on the product tile, using Wax London's Model view toggle. Off for control. On for the variation. Same products, same layout, same copy.
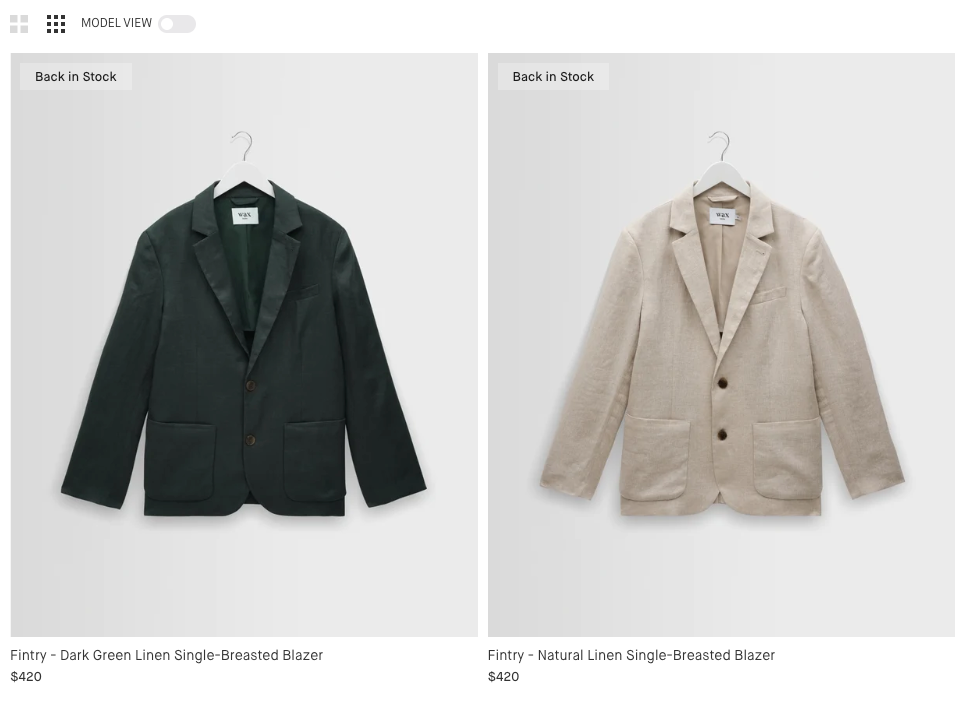
Control · Model view off
Hanger photos
The original page. Jackets on hangers as the first tile image. Clean and consistent, but no sense of fit or styling.
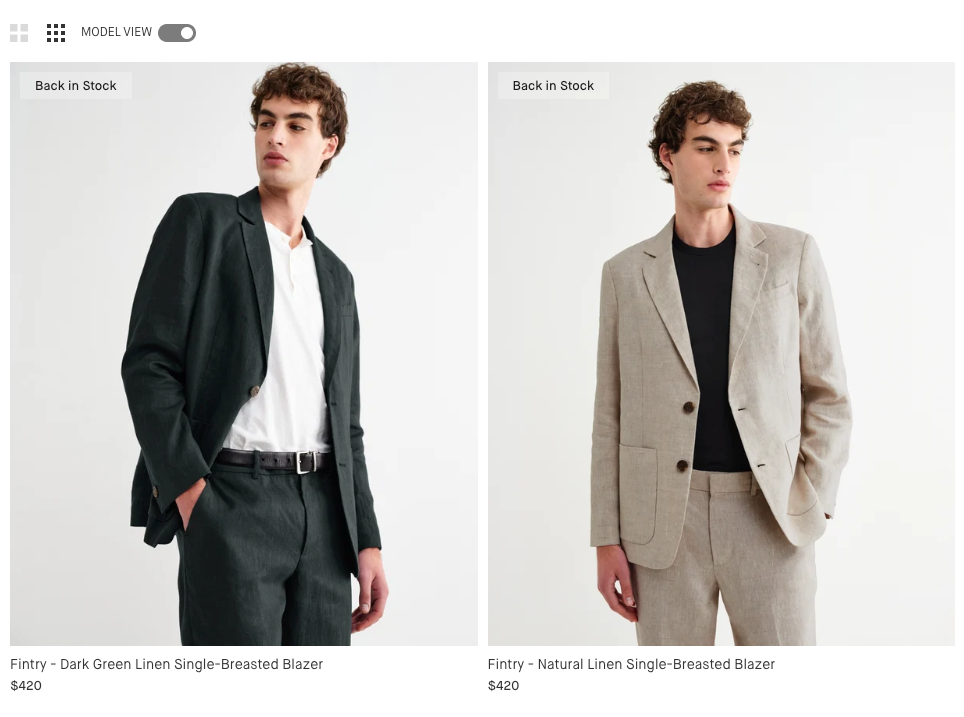
Variation 1 · Model view on
Model photos
Same products, shown on a person. You can see the fit, the drape, and how the jacket is worn. Nothing else on the page changed.
Results What happened
After 29 days and 14,115 visitors, Variation 1 made more money per visitor, converted more, and put more items in the basket. People did not click more tiles on the listing. The gain showed up later: more checkouts, more items, more revenue.
Revenue per visitor reached 98.18% confidence. Products per visitor reached 99.29%. Purchase rate was 92.55%, so close to the usual 95% bar, but not over it. Listing clicks were flat (27.6% confidence). These figures come from Convert's main Purchase goal.
Insights What this tells us
Seeing the fit helped people buy
Purchase rate went from 3.36% to 3.97%. Revenue per visitor went from $10.56 to $15.87. A model shot shows shape and styling in a way a hanger cannot.
Baskets got bigger
Average order value went from $315.59 to $390.98. Items per order went from 2.33 to 2.97. That looks like people building an outfit, not grabbing one piece.
We did not win with more listing clicks
Tile clicks were flat. Product page views were slightly down. The extra money did not come from more people opening products. It came from what they did after they arrived: more checkout, more items, more spend. Those who opened a product also scrolled further.
Bounce rate did not get worse
Bounce went from 88.69% to 88.20%. That is basically unchanged. An early snapshot made bounce look like a risk. The finished data does not.
Caveats What this does not prove
Purchase rate is not at 95% confidence. Convert gives purchase rate 92.55%, revenue per visitor 98.18%, and products per visitor 99.29%. The money story lines up, but 235 vs 283 purchases is still the noisier number.
This is suiting only. 14,115 visitors is a fair sample for this category. It does not mean the same photo swap will work on t-shirts, knitwear, or belts, where fit is less of a question.
It ran in spring. 17 April to 15 May 2026 sits in suiting and linen season. Do not scale the $39,145 gap to a full year. The percentage lifts are the part that should travel.
Convert had two purchase goals. The main Purchase goal shows revenue per visitor up 50.28%. A manual purchase goal shows a smaller lift, 19.45% at 81.49% confidence, with almost no change in order value. Both favour Variation 1. This write-up uses the main goal.
Conclusion What this means
Turn model photos on for suiting pages
The test is done. Revenue per visitor, products per visitor, and 100% product-page scroll all cleared 95% confidence for Variation 1. Purchase rate and begin checkout move the same way. Listing clicks did not need to rise for revenue to rise.
Set Model view on as the default for suiting and tailoring collections. Then run the same one-change test on shirts. Do not switch the whole catalogue at once.
Do this now
Roll out Variation 1 on the six tested suiting collections. Watch revenue per visitor and order value in your live analytics for a few weeks after launch.
Test this next
Try model-first tiles on shirts and formal extras. Keep the photo as the only change. Do not assume you need more listing clicks to make it worth doing.
Work with me
Want results like this for your store?
Let’s design experiments that move revenue, not just run tests.